A bigger balance can keep you in our free Plinko for longer. It cannot make the next ball luckier. And reaching the end of a long game is not the same as making a profit.
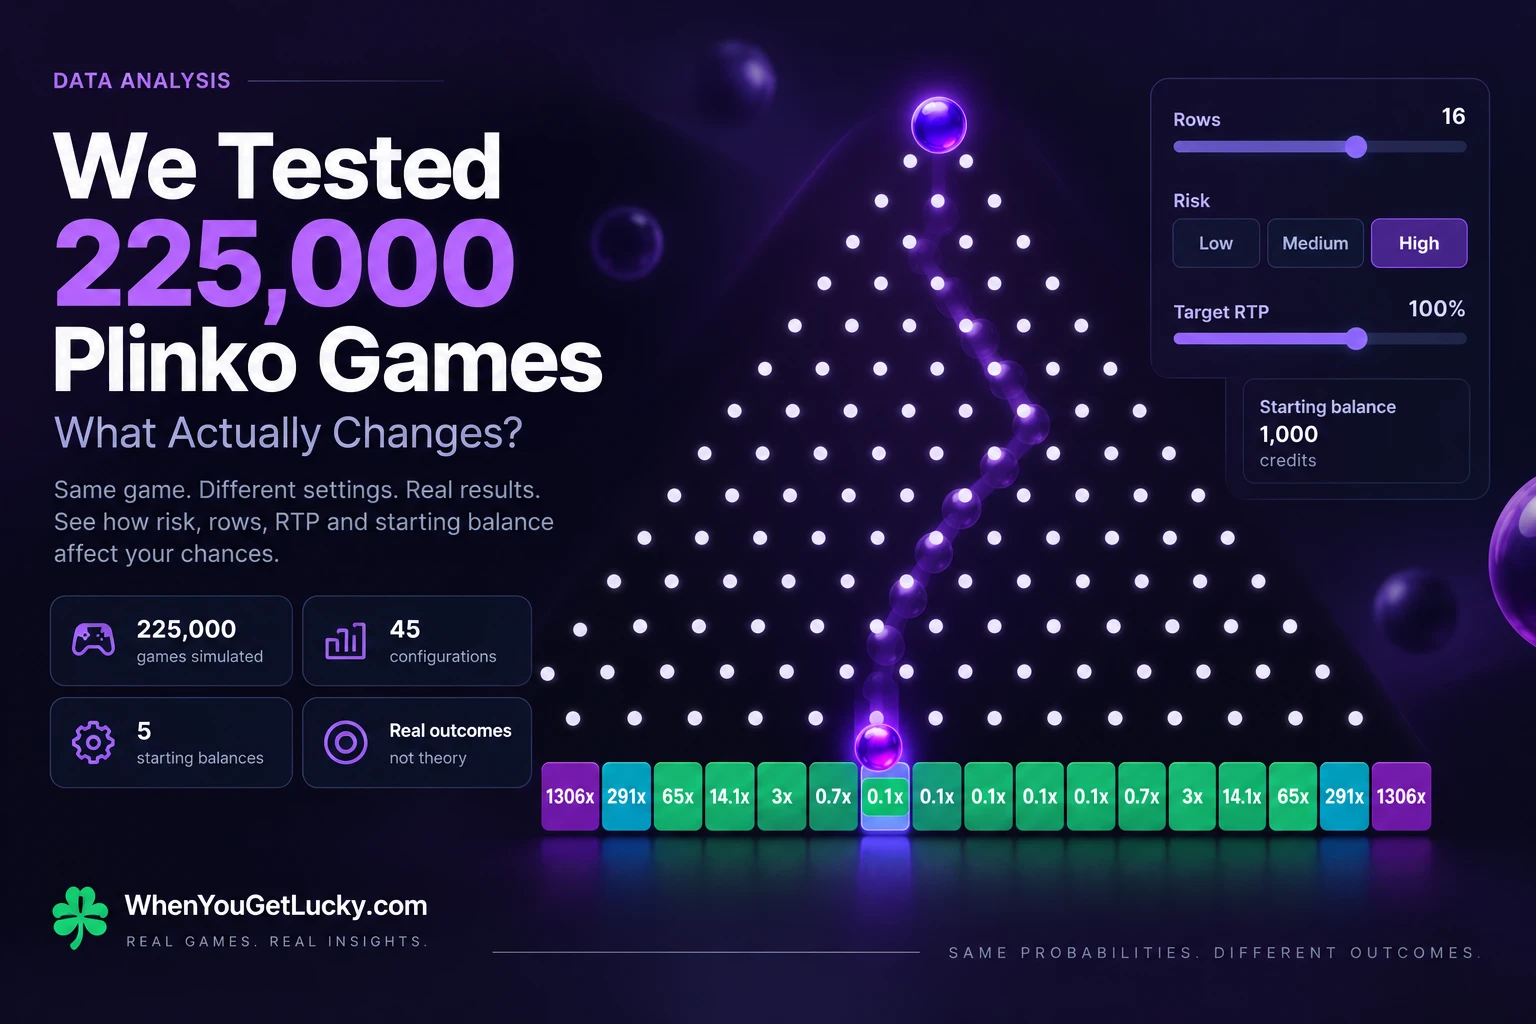
We compared 225,000 test games in our own virtual-credit model: balances of 20, 50, 100, 500 and 1,000; 8, 12 and 16 Rows; Low, Medium and High Risk; and Target RTP of 97%, 99%, 100%, 101% and 105%. Each of the 225 combinations had 1,000 starts. One test game means up to 10,000 drops at a fixed bet of 1, stopping when the balance cannot cover the next bet.
We also saved every full run to see what would happen with enough credits to finish. The five starting balances followed the same outcomes, so we could see what the extra funds changed. RTP settings above 100% are experimental settings in our model. These are virtual games, not a test of a casino or a way to earn money.
Compare the settings yourself
Choose the setting to compare. The other three stay fixed. Every row below includes all 1,000 starts, including games that stopped early. Profit/loss (P/L) is returned credits minus wagered credits. It is not the ending balance. A 100-credit start with P/L of −30 ends with 70 credits.
Target RTP is the requested setting. Theoretical RTP is the return calculated from the actual payout table. Observed RTP is total returned divided by total wagered in this sample. They need not match. “Profitable” means ending with more credits than at the start; “completed” means making all 10,000 drops.
Does a bigger balance help you finish?
Yes, but sometimes the smaller balance already does everything the larger one can. Across all 450 balance comparisons, more starting credits helped more games finish in 386 cases and made no difference in 64. They never made a game stop sooner.
At 16 Rows, High Risk and Target 100%, raising the balance from 100 to 1,000 increased completion from 66 to 743 games out of 1,000. That is a gain of 67.7 percentage points. At 8 Rows, Low Risk and Target 100%, balances of 100, 500 and 1,000 all finished 1,000 out of 1,000 games.
The extra credits pay for a longer run of losses. They do not change the slots or multipliers. If both balances reach the finish on the same sequence, their P/L is exactly the same. For choosing settings, a larger balance changes how much of the sequence you can afford to play. Once both balances finish, more starting credits add nothing to that sequence’s profit.
Does that mean a bigger balance improves profit?
It does not make the next drop pay better. But it can change the result of the whole game by letting you keep playing. When a game pays back less than you bet on average, more bets mean a larger expected loss. When it pays back more, more bets mean a larger expected gain. At exactly fair odds, the expected gain or loss is zero.
If two balances both fund all 10,000 drops, they place the same bets and collect the same payouts. Their profit or loss is identical. The difference starts when one balance runs out earlier.
Our results show both directions. At Target 97%, a bigger balance lowered the average result in 87 comparisons; the other 3 tied. At experimental Target 105%, it improved the average in 59 comparisons and tied in 31. None got worse at that target.
Near 100%, a small gain in the average can easily be misleading. At 16 Rows / High / Target 100%, moving from 100 to 1,000 credits improved the average result by about 22 credits. Yet 425 games did better, 509 did worse and 66 tied. The middle change was a 24.8-credit loss. More funds clearly helped games finish here, but the sample does not show a reliable profit benefit.
Across the whole study, extra funds usually made losses larger on tables that pay back less than the bet on average. The reverse usually happened on tables that pay back more. Exactly fair tables showed no clear profit benefit from a larger balance. Choose how much play you can afford, rather than expecting more funds to improve the odds.
How can average profit be positive when most games lose?
Rare large wins can carry the average. In 44 of the 225 combinations, the average result was a profit while the typical game lost credits: 17 at Target 100%, 16 at 101% and 11 at 105%. Here, “typical” means the median: the middle result when games are sorted from worst to best.
At experimental Target 105%, all 45 combinations made a profit on average, yet 11 still had a losing typical game. Eight used High Risk and three used Medium. None used Low Risk or a 1,000-credit balance. This was a recurring pattern at the higher targets, not just one unusual game. Small average gains at Target 100% were much less convincing.
For example, 16 Rows / High / Target 105% with 100 credits averaged a 94.2-credit profit. But the typical result was a 99.4-credit loss. Only 127 out of 1,000 games made a profit. The middle 90% of results ranged from −99.9 to +1,477.5 credits. A few large payouts lifted the average while the typical game lost almost its entire starting balance.
Read the average, typical result and profitable-game count together. A positive average does not mean that a profitable game is likely. The detailed tables also show p5–p95: the range covering the middle 90% of results, with the most extreme results left out.
Does Low Risk always last longer?
Raising Risk spread the full-run results further apart in all 45 Risk comparisons. It also increased the starting funds needed to finish 95% of those runs, every time. High Risk meant bigger swings in this model.
But completion with a limited balance had an exception. Across 225 Risk comparisons, higher Risk reduced completion in 165, increased it in 31 and tied in 29. Every increase came at Target 97% or 99% with a small balance of 20, 50 or 100. There were no increases at Targets 100%, 101% or 105%.
| Rows | Low /1,000 | Medium /1,000 | High /1,000 |
|---|---|---|---|
| 8 | 0 | 29 | 63 |
| 12 | 0 | 59 | 74 |
| 16 | 0 | 67 | 48 |
With a small balance and a negative edge, small payouts can lead to steady depletion. Bigger swings sometimes rescue a game long enough to reach the finish. That does not make High Risk profitable: all 45 Target 97% combinations had negative mean P/L. With 500 starting credits at the same Target, Low finished every game at all three Rows settings, while Medium and High finished fewer. For smoother play, Low Risk helped; the small-balance reversal is a survival exception, not a winning strategy.
What changes when you add more Rows?
With Risk and Target RTP held fixed, more Rows widened the middle 90% range in all 45 comparisons. Every comparison also needed more starting credits to get 95% of the full runs to the finish. More Rows made a long game harder to fund consistently.
| Rows | P/L p5 | P/L p95 | Required balance median | Required balance p95 |
|---|---|---|---|---|
| 8 | −421.7 | +439.6 | 174.3 | 497.5 |
| 12 | −835.4 | +949.9 | 336.2 | 962.8 |
| 16 | −1,498.5 | +1,782.9 | 655.2 | 1,645.5 |
The limited-balance completion result was less absolute: 145 of 225 comparisons fell, 20 rose and 60 tied. All 20 reversals were at Targets 97% or 99%, where extra swings could occasionally keep a depleted game alive. At Targets 100%, 101% and 105%, completion never improved when Rows increased. Choose Rows with the payout table in mind. These results do not establish a universal rule for other Plinko designs.
Does higher RTP always help?
Higher Target RTP improved the average result in all 450 comparisons with a limited balance and all 90 comparisons of full runs. This was the clearest and most consistent profit effect in the study.
More games finished in 348 of those 450 comparisons. There were 101 ties and one small drop. At 16 Rows / High / balance 100, moving Target RTP from 99% to 100% took finishers from 68 to 66 out of 1,000. Profitable games fell from 66 to 65, while the average result improved by 6.7 credits. That small exception is too uncertain to count as a reason to avoid higher RTP.
Why can that happen? Changing the target does not raise every slot’s payout by the same amount. Small payout differences can change when a game runs out of credits. And “Target 100%” is not always exactly fair. The actual theoretical return is about 99.99% at 16 Rows / High and 99.96% at 12 Rows / Medium. Only the three 8-Row tables at Target 100% are exactly 100%.
For choosing settings, check theoretical RTP rather than relying on a rounded target label. Our 101% and 105% settings are experimental positive-return cases, not claims about offers at casinos. Observed RTP is a sample result, not a promised rate for your next game.
Compare the same saved 1,000 drops in our Plinko RTP session study and see how different payouts change each final balance.
How much balance was needed to finish 10,000 drops?
We asked a different question of every full sequence: what was the smallest starting balance that could pay for every drop? This uses the lowest balance before a bet. It is not the largest fall from an earlier peak, and it cannot be known before a real game.
| Starting credits | Qualifying combinations /45 |
|---|---|
| 20 | 4 |
| 50 | 6 |
| 100 | 9 |
| 500 | 27 |
| 1000 | 38 |
A balance of 1,000 still fell short of that 95% finish rate in 7 of 45 configurations: 12 Rows / High at Targets 97% and 99%, plus 16 Rows / High at all five targets. Those settings needed roughly 1,087 to 1,828 starting credits to get 95% of their saved runs to the finish. The exact figures are in the study data and Methodology.
The threshold predicted completion exactly in all 225,000 saved games. It is a useful way to compare how demanding settings were in this sample. It is not a deposit recommendation or a guarantee that the next sequence will fit the same reserve.
Why finishing is not the same as winning
Across the complete grid, 125,322 games finished and 99,678 stopped early. Every early stop lost credits. Among the games that finished, 83,076 made a profit, 42,227 lost and 19 broke even. Completion exceeded the profitable-game count in 155 of 225 combinations.
Look at 16 Rows / High / Target 97% / balance 100. All 48 games that finished were profitable. That sounds like a 100% success rate until you include the other 952 starts. The real profitable-game rate for that cell was 48/1,000, or 4.8%. At Low Risk / Target 97% / balance 500, all three Rows settings finished 1,000/1,000 games, yet none made a profit.
A long game can be a losing game. Use completion to compare playing time and profitable starts to compare the sample’s outcomes. Do not judge settings only by the games that survived.
Can a tiny result range hide a near-total loss?
It can. In 42 of 225 combinations, the middle 90% of results fitted into a band less than one credit wide. These were exactly the combinations where at least 950 games stopped early. They included 13 Low, 11 Medium and 18 High Risk settings.
At 8 Rows / Low / Target 97% / balance 100, every game stopped early. The middle 90% lost between 99.1 and 99.3 credits. That tiny range meant almost everyone lost nearly the whole balance. At 16 Rows / High / Target 105% / balance 20, 976 games stopped early. The middle 90% lost 19.1 to 19.9 credits, yet a few rare wins lifted the average to +15.4. That average was too uncertain to show a reliable profit.
An early stop leaves less than one credit, so most stopped games cluster just above a loss of the whole starting balance. The middle 90% range leaves the outer tails out. A tight range is not evidence of gentle settings; check the stop count and median before calling it reassuring.
Which settings had the highest average profit?
We compared the average profit across all 225 combinations. Here are the top five, including the tie for fourth. All used experimental Target 105%. This is a snapshot of the sample, not a universal ranking.
| Rows / Risk / Target / Balance | Average P/L | Typical P/L (median) | Profitable /1,000 | Completed /1,000 | P/L p5 to p95 |
|---|---|---|---|---|---|
| 12 / High / 105% / 1,000 | 512.5 | 508.1 | 810 | 994 | -401.4 to 1,506.3 |
| 16 / Medium / 105% / 1,000 | 507.7 | 505.8 | 941 | 1000 | -25.4 to 1,068.8 |
| 16 / Medium / 105% / 500 | 507.5 | 505.8 | 941 | 999 | -25.4 to 1,068.8 |
| 8 / High / 105% / 500 | 505.0 | 507.7 | 968 | 1000 | 61.3 to 948.1 |
| 8 / High / 105% / 1,000 | 505.0 | 507.7 | 968 | 1000 | 61.3 to 948.1 |
The highest average profit came from 12 Rows / High / Target 105% / balance 1,000: +512.5 credits, with 810 profitable games. But 16 Rows / Low / Target 105% with balances of 50, 100, 500 or 1,000 averaged a slightly smaller +503.9 and made a profit in all 1,000 sample games. Its middle 90% range was +385.7 to +621.1, much tighter than the leader’s −401.4 to +1,506.3.
The highest average did not come with the best chance of a profitable game. And the small gap between these averages could be down to chance. The two 8-Row / High entries tied exactly because both balances finished the same runs. Use the table to compare the kinds of results each setting produced, not to pick a guaranteed winner.
How often did the maximum multiplier land?
For this check, we fixed 16 Rows and High Risk. The maximum pays only in the first and last of the 17 slots: slot 0 on the left and slot 16 on the right. The maximum is a gross return, including the bet. A 1-credit drop at 1,306× returns 1,306 credits, for a net gain of 1,305.
| Target RTP | Maximum | Slots |
|---|---|---|
| 97% | 1,267× | 0 and 16 only |
| 99% | 1,293× | 0 and 16 only |
| 100% | 1,306× | 0 and 16 only |
| 101% | 1,319× | 0 and 16 only |
| 105% | 1,371× | 0 and 16 only |
Across the full 10,000,000 drops, the left edge landed 161 times and the right edge 151 times: 312 hits, or roughly 3 hits per 100,000 drops. There were 272 games with at least one hit and 728 with none, out of 1,000 full games. A game can hit more than once, so hits and games with hits are different counts.
These 312 hits belong to one shared set of 10 million drops. All five RTP tables use those same paths. Five targets do not turn this into 50 million independent drops. The maximum payout changes; the full-sequence hit count does not.
What more balance changes
At Target 100%, a 20-credit balance actually played 292,109 drops: 11 maximum hits in 7 games. A 1,000-credit balance played 9,063,429 drops: 281 hits in 244 games. More funds allowed more of the same paths to be played; they did not make an individual slot more likely. The rates use actual played drops, including both completed and early-stopped games, not the full ten million.
Observed vs theoretical odds
For 16 rows with independent, equally likely left/right turns, the probabilities are different for one edge and for both together. The two edge slots together have a theoretical 1-in-32,768 chance per drop. One specific edge has a 1-in-65,536 chance. That is a calculation, separate from the hits we actually counted. Rare events and different stopping points can move the observed rate around. Looking only at games that ran out of credits would also leave out many games helped by a big hit.
A higher maximum is not a promise that you will see it. For a different game’s published probability, read How Rare Is the 10,000× Multiplier in Stake Plinko? Our multipliers and counts here describe our model, not Stake’s.
What to take into your next free game
Start with the experience you want to compare. Low Risk and fewer Rows produced narrower full-sequence results here. A larger balance bought more playing time, not better odds per drop. Higher theoretical RTP improved expected return, but even our positive-return experimental tables could leave most small-balance games losing. Finishing, winning and seeing a rare multiplier are three different goals.
Use the Plinko Simulator to explore distributions, the Odds calculator to read the payout maths, and Plinko Strategy for the relationship between risk, bet size and balance. These explain the mechanics; they do not predict your next ball.
Method, data and limits
We tested our own virtual-credit Plinko model using 1,000 games for each setting combination. Each starting balance followed the same saved outcomes, so we could compare what extra funds changed. Every start counts, including games that ran out of credits. We also checked the full runs to find the smallest balance each needed to finish.
These results describe this sample, not your next game or a particular casino. Rare wins can move an average a long way. Even a setting that won in every saved game can lose in a future one. Targets above 100% are experimental settings in our model. Rounded numbers make the article easier to read; the downloads retain the full precision.
Download study data (CSV) — all 225 combinations. For the full method, statistical checks and limitations, Download methodology (MD).
For a closer look: Full reproducibility package.